Iowa’s Changing Climate: An analysis of precipitable water, temperature and precipitation change over America’s heartland.
Meteorologist Nick Stewart
Record rain in 2018 slammed eastern Iowa breaking a total yearly precipitation record in Waterloo and other eastern Iowa reporting stations north of Highway 20. The Cedar River in Cedar Rapids was sent into flood stage later than ever before.
2018 will go down as the fourth warmest year globally, 1.42° above normal
According to the National Oceanic and Atmospheric Administration, global temperatures in 2018 were 1.42 degrees above normal, making it the fourth warmest year on record behind 2016, 2015 and 2017.
A warmer atmosphere can hold more moisture, a trend that’s occurring across the Midwest. The proof? Precipitable water - a value showing the atmosphere's moisture content and how it has changed over time.
Weather balloons launched by the National Weather Service gather this data daily, twice a day, from 92 sites in the United States. Iowa is flanked by two of these sites, one in Davenport and one in Omaha, Nebraska. Matthew Bunkers, Ph.D has built an archive of this raw data and provided the information for this project.
Since 1948, there have been 41,774 launches on record from these two sites, and trends over time became quite obvious.
For this project, only 12z and 00z soundings were selected. Any special or off-hour soundings were deleted from the dataset.
Days per year with a precipitable water value of two inches or greater
Annual number of soundings with 2” or greater measured
A precipitable water value of 2.00" is considered to be extremely high, and if a rain event unfolded in that type of environment, significant flash flooding could occur. Since 1948 there has been a significant rise in recorded weather balloons with these extreme 2.00" values from less than one annually to more than four annually.
Higher precipitable water values mean more rainfall.
Annual average precipitable water value
Summer average PWAT of 12z and 00z soundings in Omaha
In the summer months of June through august, the seasonal average of precipitable water has changed by just shy of two tenths of an inch. While that doesn’t sound kike a large number, an extra two tenths of rainfall during every rainy day over a three-month stretch adds up quickly.
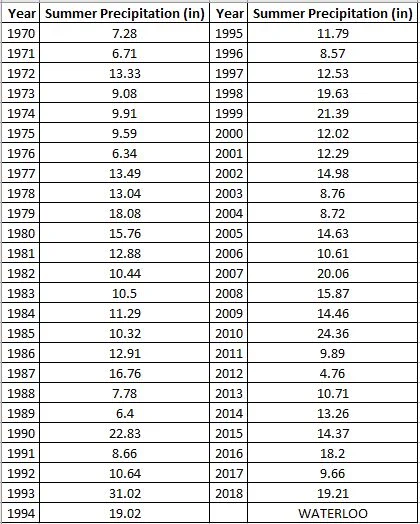
Summers are much wetter since 1965 in eastern Iowa
Since 1965, summer rainfall has trended higher in every major eastern Iowa city. Dubuque sees more than three inches of extra rain in the summer, Cedar Rapids more than 2", Iowa City more than an inch and a half with Waterloo just over an inch.
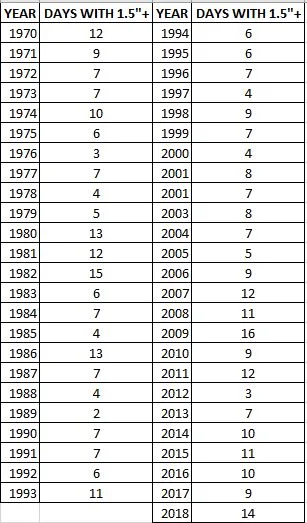
The annual number of days with 1.5” of precipitation has increased by nearly 30 percent.
Yearly summary of days with 1.5”+ of precipitation
The number of extreme precipitation events has increased in Cedar Rapids since 1970. Days with at least 1.5" of rain since 1970 has trended higher by nearly 30 percent.
The most notable change in summer temperatures are the significant reduction in days that measure 95 degrees or warmer
Yearly count of 95-degree days or warmer in Cedar Rapids
Higher humidity also has impact on temperatures during every season. In summer, average days above 95 degrees in Cedar Rapids from 1894 through 2018 fell by 12.7 days, from around 13 to less than one.
Winters are averaging several degrees warmer since 1965
The season seeing the biggest impact of climate change - winter. Temperatures are far warmer in winter since 1965, trending as much as five degrees warmer in Waterloo and three degrees in Cedar Rapids, Iowa City and Dubuque.
However a warmer temperature does not mean less snowfall, in fact, it's the opposite. That's because the average temperature is still below the freezing mark. These storm systems now have more moisture to work with.
Seasonal snowfall has trended higher in all eastern Iowa cities
Waterloo has seen a trend of more than a foot of snow increase since 1965. Dubuque has risen on average nine inches. Cedar Rapids and Iowa City have both trended higher by close to a half of foot of snow.
Warmer winters with more snowfall, slightly cooler summers with more rainfall but much higher heat indices. That's the changing Iowa climate.


